Customer satisfaction score (SAT)
Customer satisfaction is a metric that directly measures the level of satisfaction of your customers based on their experience in your establishment.
The score is out of 5 and is based on the star-rating questions in the surveys.
How is the customer satisfaction score (SAT) calculated?
For an establishment:
- Step 1: Calculate the average score for each satisfaction question in each survey (⭐️⭐️⭐️⭐️⭐️).
- Step 2: Calculate the average of the average scores obtained in Step 1.
For a Brand Level/Group of Establishments (region, sector):
- Step 1: Obtain the SAT score for each location of the brand that you want to consolidate.
- Step 2: Calculate the average of the scores obtained in Step 1.
Example 1: Calculating SAT for a point of sale:
Customer Satisfaction Score = Average star rating of all surveys for the point of sale.
The average score per question is used as the basis, not the overall average of the total volume of responses to the satisfaction questions.
| Survey A | Survey B | |
|---|---|---|
| Question 1 | Average of 3.4/5 | Average de 2,8/5 |
| Question 2 | Average of 3.4/5 | Average de 3,0/5 |
| Question 3 | Average of 4.8/5 | - |
| Overall SAT Score for the establishment |
=(3.4+2.8+4.8+3.4+3.0)/5 = Average of 3.68/5 |
Info: The goal is to give equal weight to each question, regardless of the number of responses per question.
Example 2: Calculating SAT for a group of establishments (region, sector):
Customer Satisfaction Score = Average of the customer satisfaction scores for each point of sale (Example 1 calculation).
The following example is for a group of two establishments:
| Customer Satisfaction Score | |
| Point of Sale 1 | Average de 3,25/5 |
| Point of Sale 2 | Average de 3,5/5 |
| Overall score |
=(3,25+3,5)/2 = average of 3,37/5 |
Info: The goal is to give equal weight to each point of sale, regardless of the number of entries per point of sale.
Overview of the SAT Tab:
- Reminder of the period selected by the user.
- Customer Satisfaction Score (SAT)
- Comparison with the selected Y-1 period.
- A display of the customer satisfaction score and the volume for the Y-1 period.
- Number of participations, and information on the basic calculation of the customer satisfaction score in SAT mode.
- A display of the customer satisfaction score in the form of stars. The stars are colored yellow according to the score obtained.

Note:
A participation = a customer responding to the survey and at least one star question. So, even if your customer does not fully complete the questionnaire, we record the questions they answered.
Ranking:
Displays the ranking of the selected location regarding brand's other places and/or regional level.
This element can be clicked to display the ranking at the brand level. This ranking shows the names of locations in ascending order according to their rank, as well as the customer satisfaction score, the number of participations, and a visualization of the customer satisfaction score in the form of stars.

Note: for a multi-access view the ranking is displayed at the end of the customer satisfaction page (as shown above)
Distribution and Evolution
The distribution of customer satisfaction scores by other criteria such as the questionnaire, collection channel, etc.

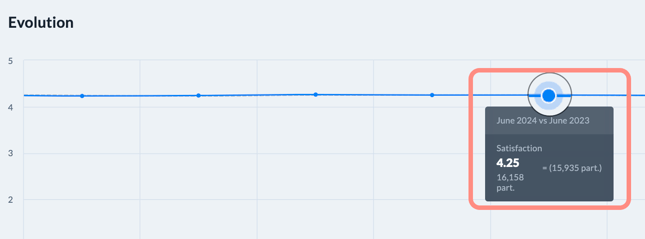
An evolution chart is available to track the change in your store's or area’s customer satisfaction score if you have access to multiple points of sale. This evolution can be viewed in granular detail by days, weeks, months, years, or quarters.

Clicking on the displayed evolution line shows a detailed card: comparing the current score vs. Y-1 and the percentage change (negative, equal, or positive).
